Applications of PITLAKQ at Lake Kepwari
Site
Lake Kepwari in Western Australia is a post mining lake. Please see publications for a more detailed description. This site offer some example figures different kind of modeling results.
Physical Modeling
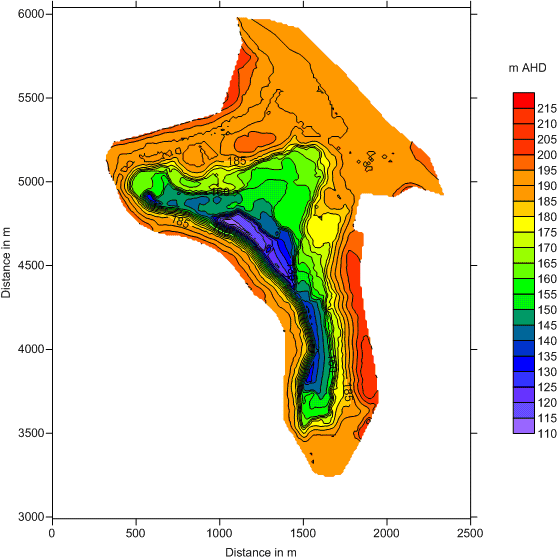
Bathymetry of lake Kepwari. Used to generate model input.
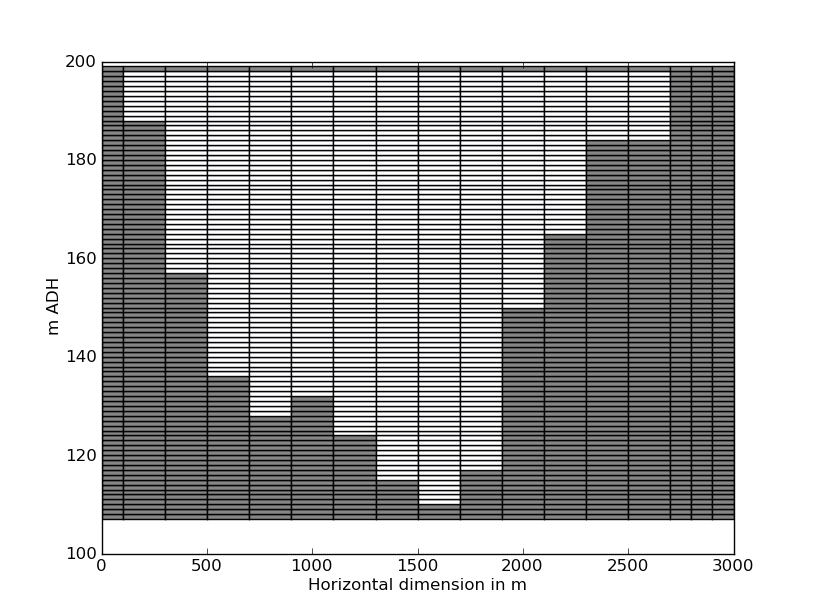
Model discretization made from bathymetry data.
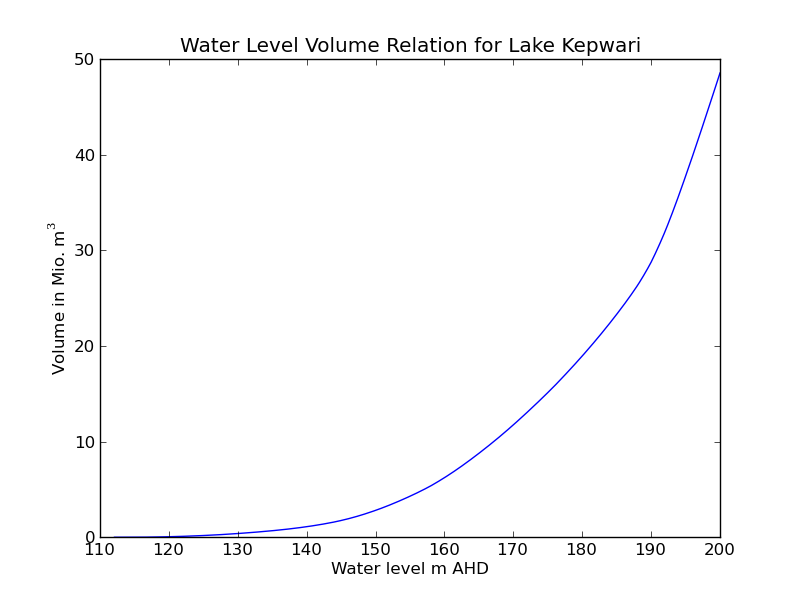
Water level volume relationship.
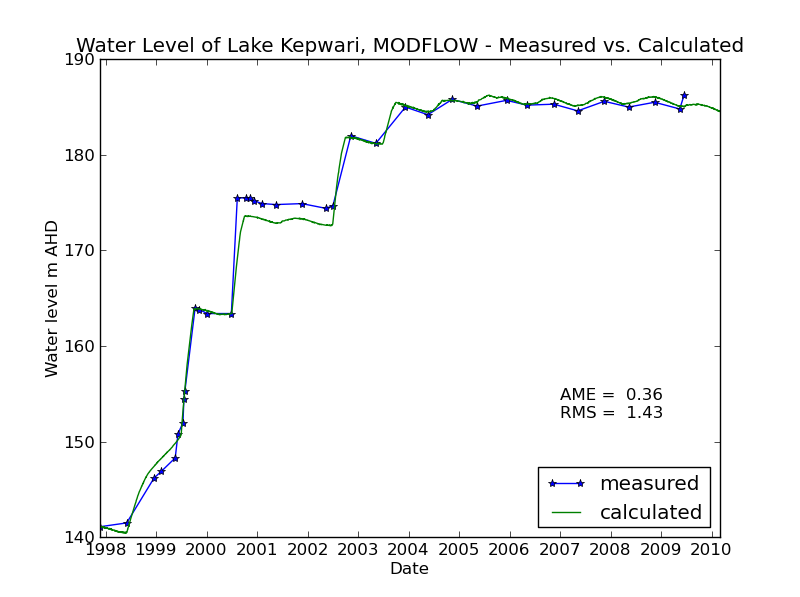
Measured and modeled water level development after calibration of groundwater exchange.
Water temperature
This video shows how the water temperature develops over time. The summer stratification and the overturns in spring and fall can be clearly seen. Not this in Australia so summer is during winter of the northern hemisphere.
Water Quality Scenarios
Eight water quality scenarios were modeled. The tables gives an overview of the combination of different boundary conditions that represent sources or sinks of acidity.
ID |
groundwater exchange |
surface runoff |
erosion |
|||||
no runoff |
low acidity |
high acidity |
no erosion |
low acidity |
medium acidit |
high acidity |
||
0 |
likely |
x |
x |
|||||
1a |
likely |
x |
x |
|||||
1b |
likely |
x |
x |
|||||
2a |
likely |
x |
x |
|||||
2b |
likely |
x |
x |
|||||
2c |
likely |
x |
x |
|||||
3a |
minimal |
x |
x |
|||||
3b |
doubled |
x |
x |
|||||
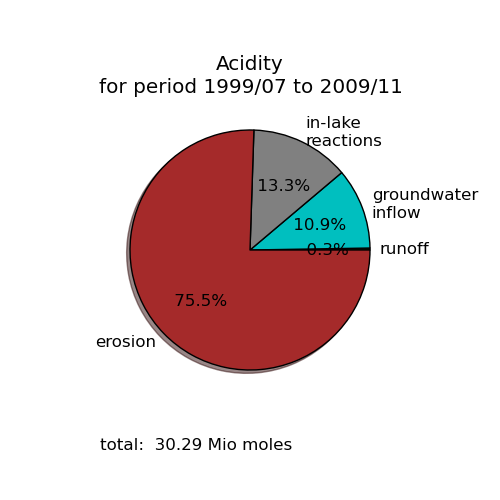
Example for the compilation of all acidity sources over the whole modeling time.
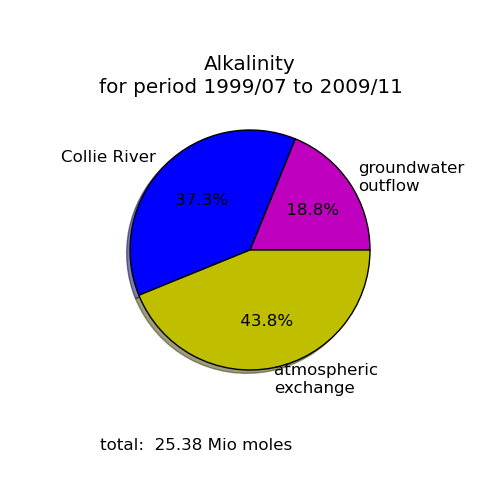
Example for the compilation of all alkalinity sources over the whole modeling time.
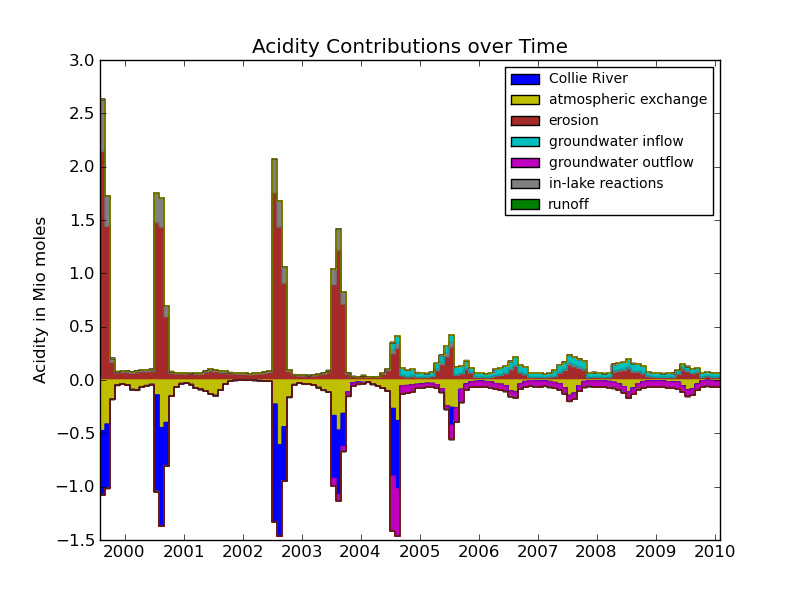
Example for the a diagram with monthly sums of all acidity and alkalinity sources.
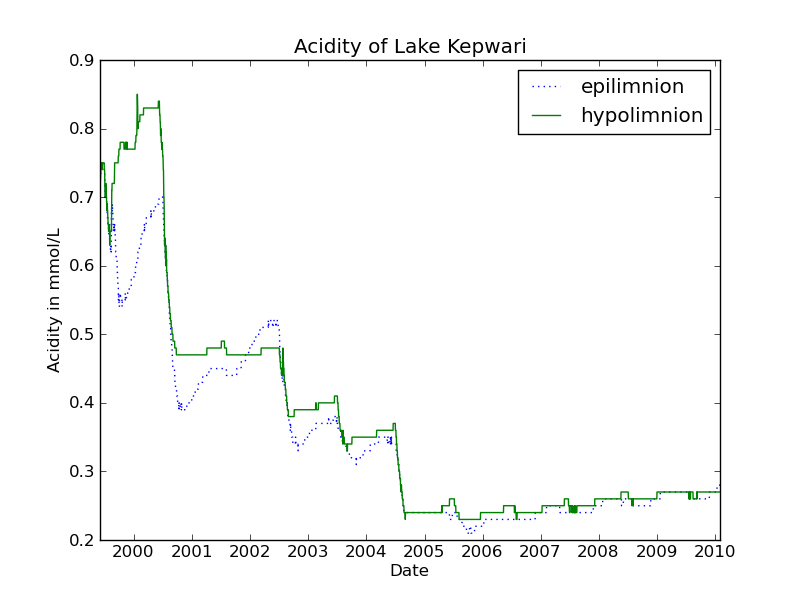
Example for the acidity in epilimnion and hypolimnion at the deepest point in the lake.
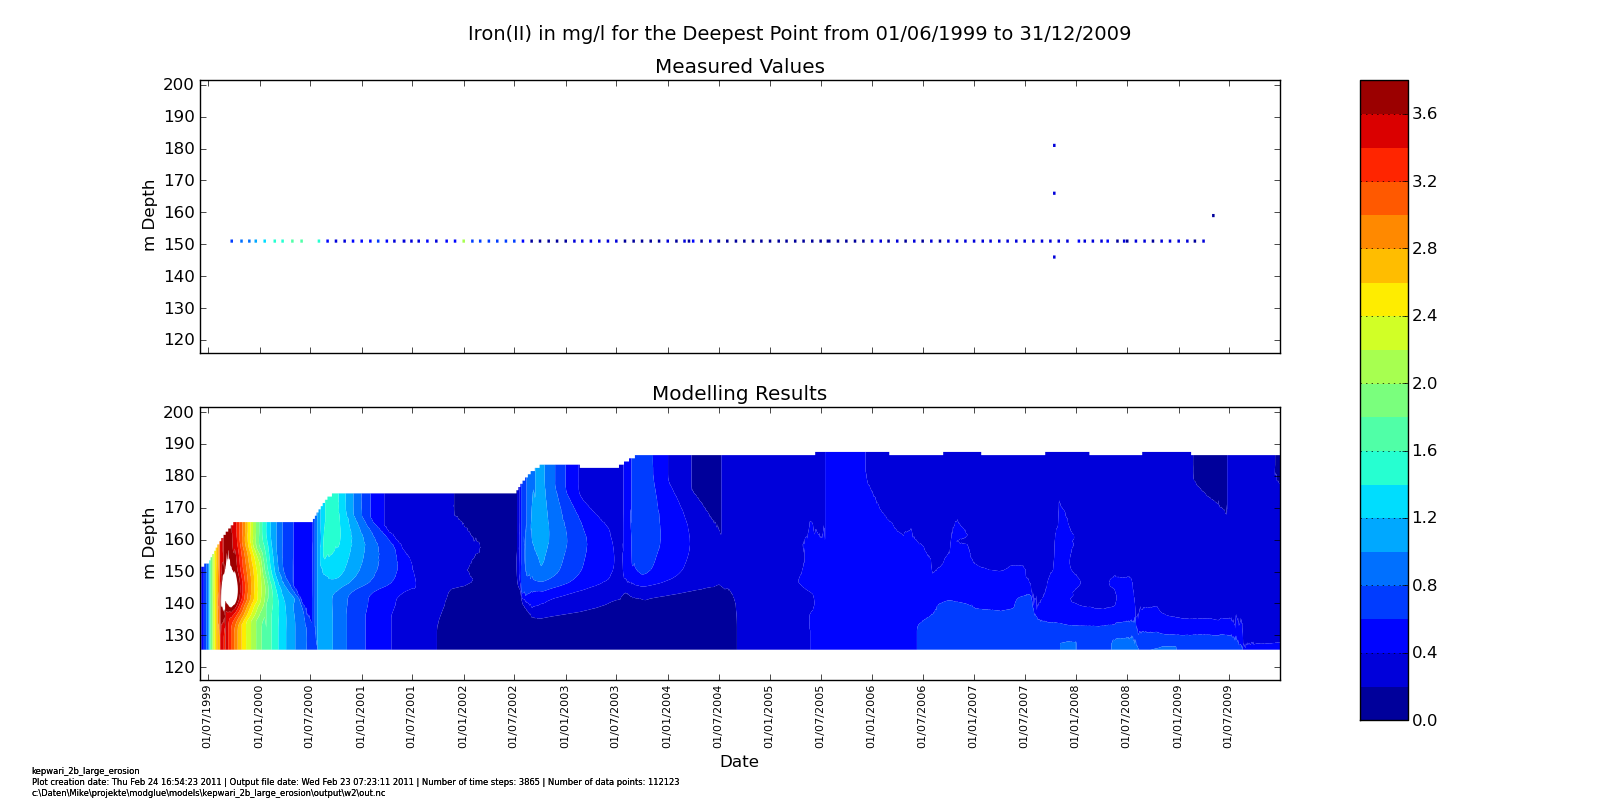
Example for the time depth distribution at the deepest point in the lake. Time step processed is one day.
Distribution of pH Value for Scenario 3b
This is an example for the development of the pH value over time and space.